


 222-223 / 568

Classification of Dementia patients based on EEG
signals using Machine learning techniques
Project process
1. EEG Signal acquisition
EEG data were obtained from the Neurology department at 'Rabin' medical center.
The data included:
•
27 dementia patients and 27 normal subjects.
•
Recording of 30 minutes for each subject.
•
EEG recording were obtained from 19 surface
electrodes placed on the scalp.
•
is set to 500Hz.
2. Preprocessing
The software used for signal processing was Matlab.
•
Converting EEG files into CSV files.
•
Artifacts were inspected visually and discarded.
•
Creating segments of 2 minutes of recording to evaluate.
•
The features extracted were EEG bands power using the Wavelet Transform (WT) and
Short Time Fourier Transform (STFT).
Mr. Aviran Ohayon (Medical Engineering), Mr. David Shaer (Electrical Engineering)
Advisor: Dr. Yehudit Aperstein
Dementia:
•
Group of disorders caused by the gradual dysfunction and
death of brain cells.
•
Causing difficulties coping with day-to-day tasks and
communicating
Currently diagnostic measures:
•
Invasive (Cerebrospinal Fluid Analysis)
•
Expensive (Neuroimaging)
•
Time-consuming (Neuropsychological Assessments)
The project goal:
•
Analyze EEG data in order to classify dementia patients
and normal subjects.
Figure 1. The international 10/20 electrode
placement system which used in this study
3. Feature extraction and dimension reduction
•
Extracting EEG bands power from 5 different bands: Delta (0.5-4 Hz), Theta (4-8 Hz), Alpha
(8-13 Hz), Beta (13-30 Hz), Gamma (above 30 Hz).
•
Total feature of 5 [Bands] * 18 [Electrodes/Patient] = 90 [Features/Patient].
Dimension reduction:
•
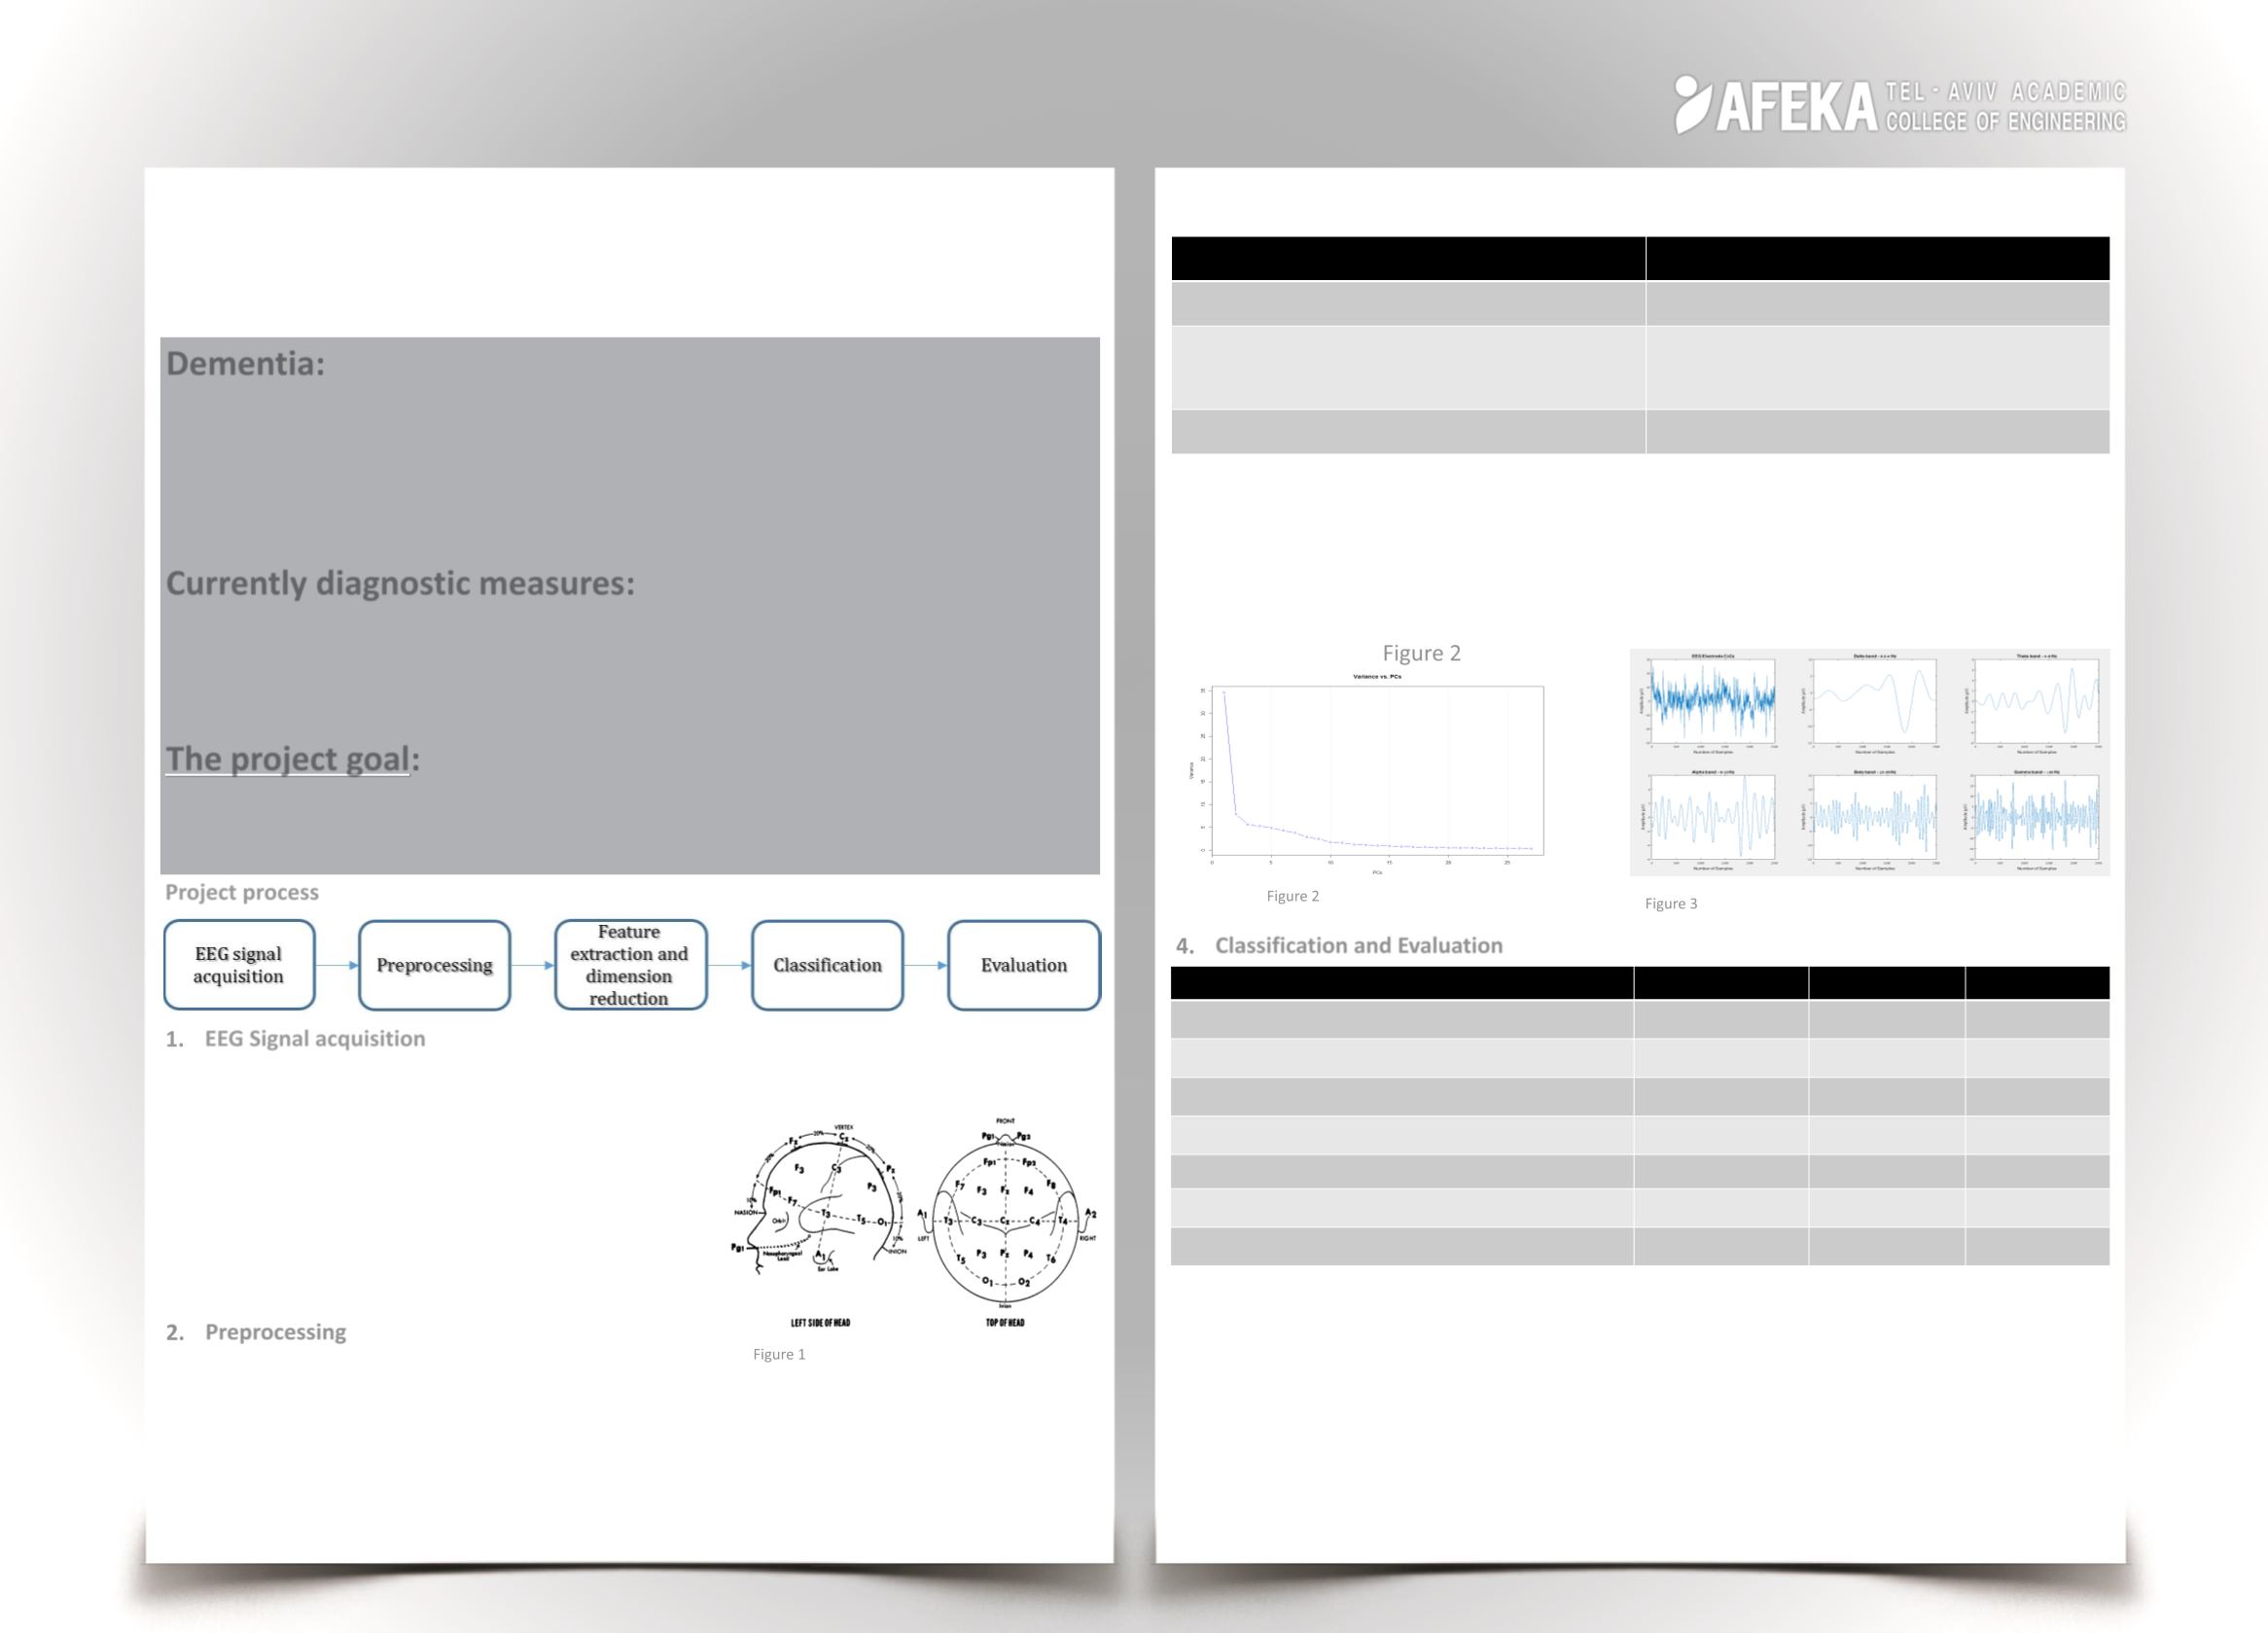
Principal component analysis (PCA):
PCA needed 27 components that contributes 95% of the variance
as can be seen in Figure 2.
4. Classification and Evaluation
Discussions and conclusions:
•
These results were similar to the results obtained in other studies using EEG bands power
as a features, our highest accuracy result was 77% while on the study of classifying
depression patients and normal subjects using machine learning techniques and nonlinear
features from EEG signal (2013) they reach 76.6% using EEG bands power features. The
advantage of our study on studies which we have learned was that we used shorter EEG
recording, and reached the same accuracy.
•
This study suggests that more nonlinear features extraction methods should be studied for
analyzing EEG of dementia patients and by that reach even better accuracy results.
WT
STFT
Gaussian function on every window
Hanning window: 0.7[sec], Overlap of 20%
Window size: 2500 samples,
Overlap size: 500 samples
Window size: 350 samples, Overlap
size:70 samples.
Wavelet transform on each window
Fourier transform for each window
Figure 2. Variance vs. Number of PCs
Figure 3. The EEG bands that extracted from the EEG raw data during
the feature extraction process.
Specifity
Sensitivity
Accuracy
Features & Classifiers
83.33%
52.08%
67.71%
DWT + PCA+ K-nearest neighbor's
81.25%
30%
55.62%
DWT + PCA+ Naive bayes
90.83%
59.17%
75%
DWT + PCA+ Random Forest
83.33%
32.50%
57.92%
DWT + PCA+ Linear Discriminant Analysis
59.22%
90.11%
74%
STFT+ Simple Tree
66.92%
85.82%
76.3%
STFT+ Coarse Gaussian SVM
77.66%
77.80%
77%
STFT+ Medium Gaussian SVM