


 566-567 / 568

Associating input
image with the
relevant disorder
Filtering the
image to achieve
vessel
enhancement
Segmentation
Filtering the
binary image
Calculating the
FAZ size
Calculating vessel
density and
fractal dimension
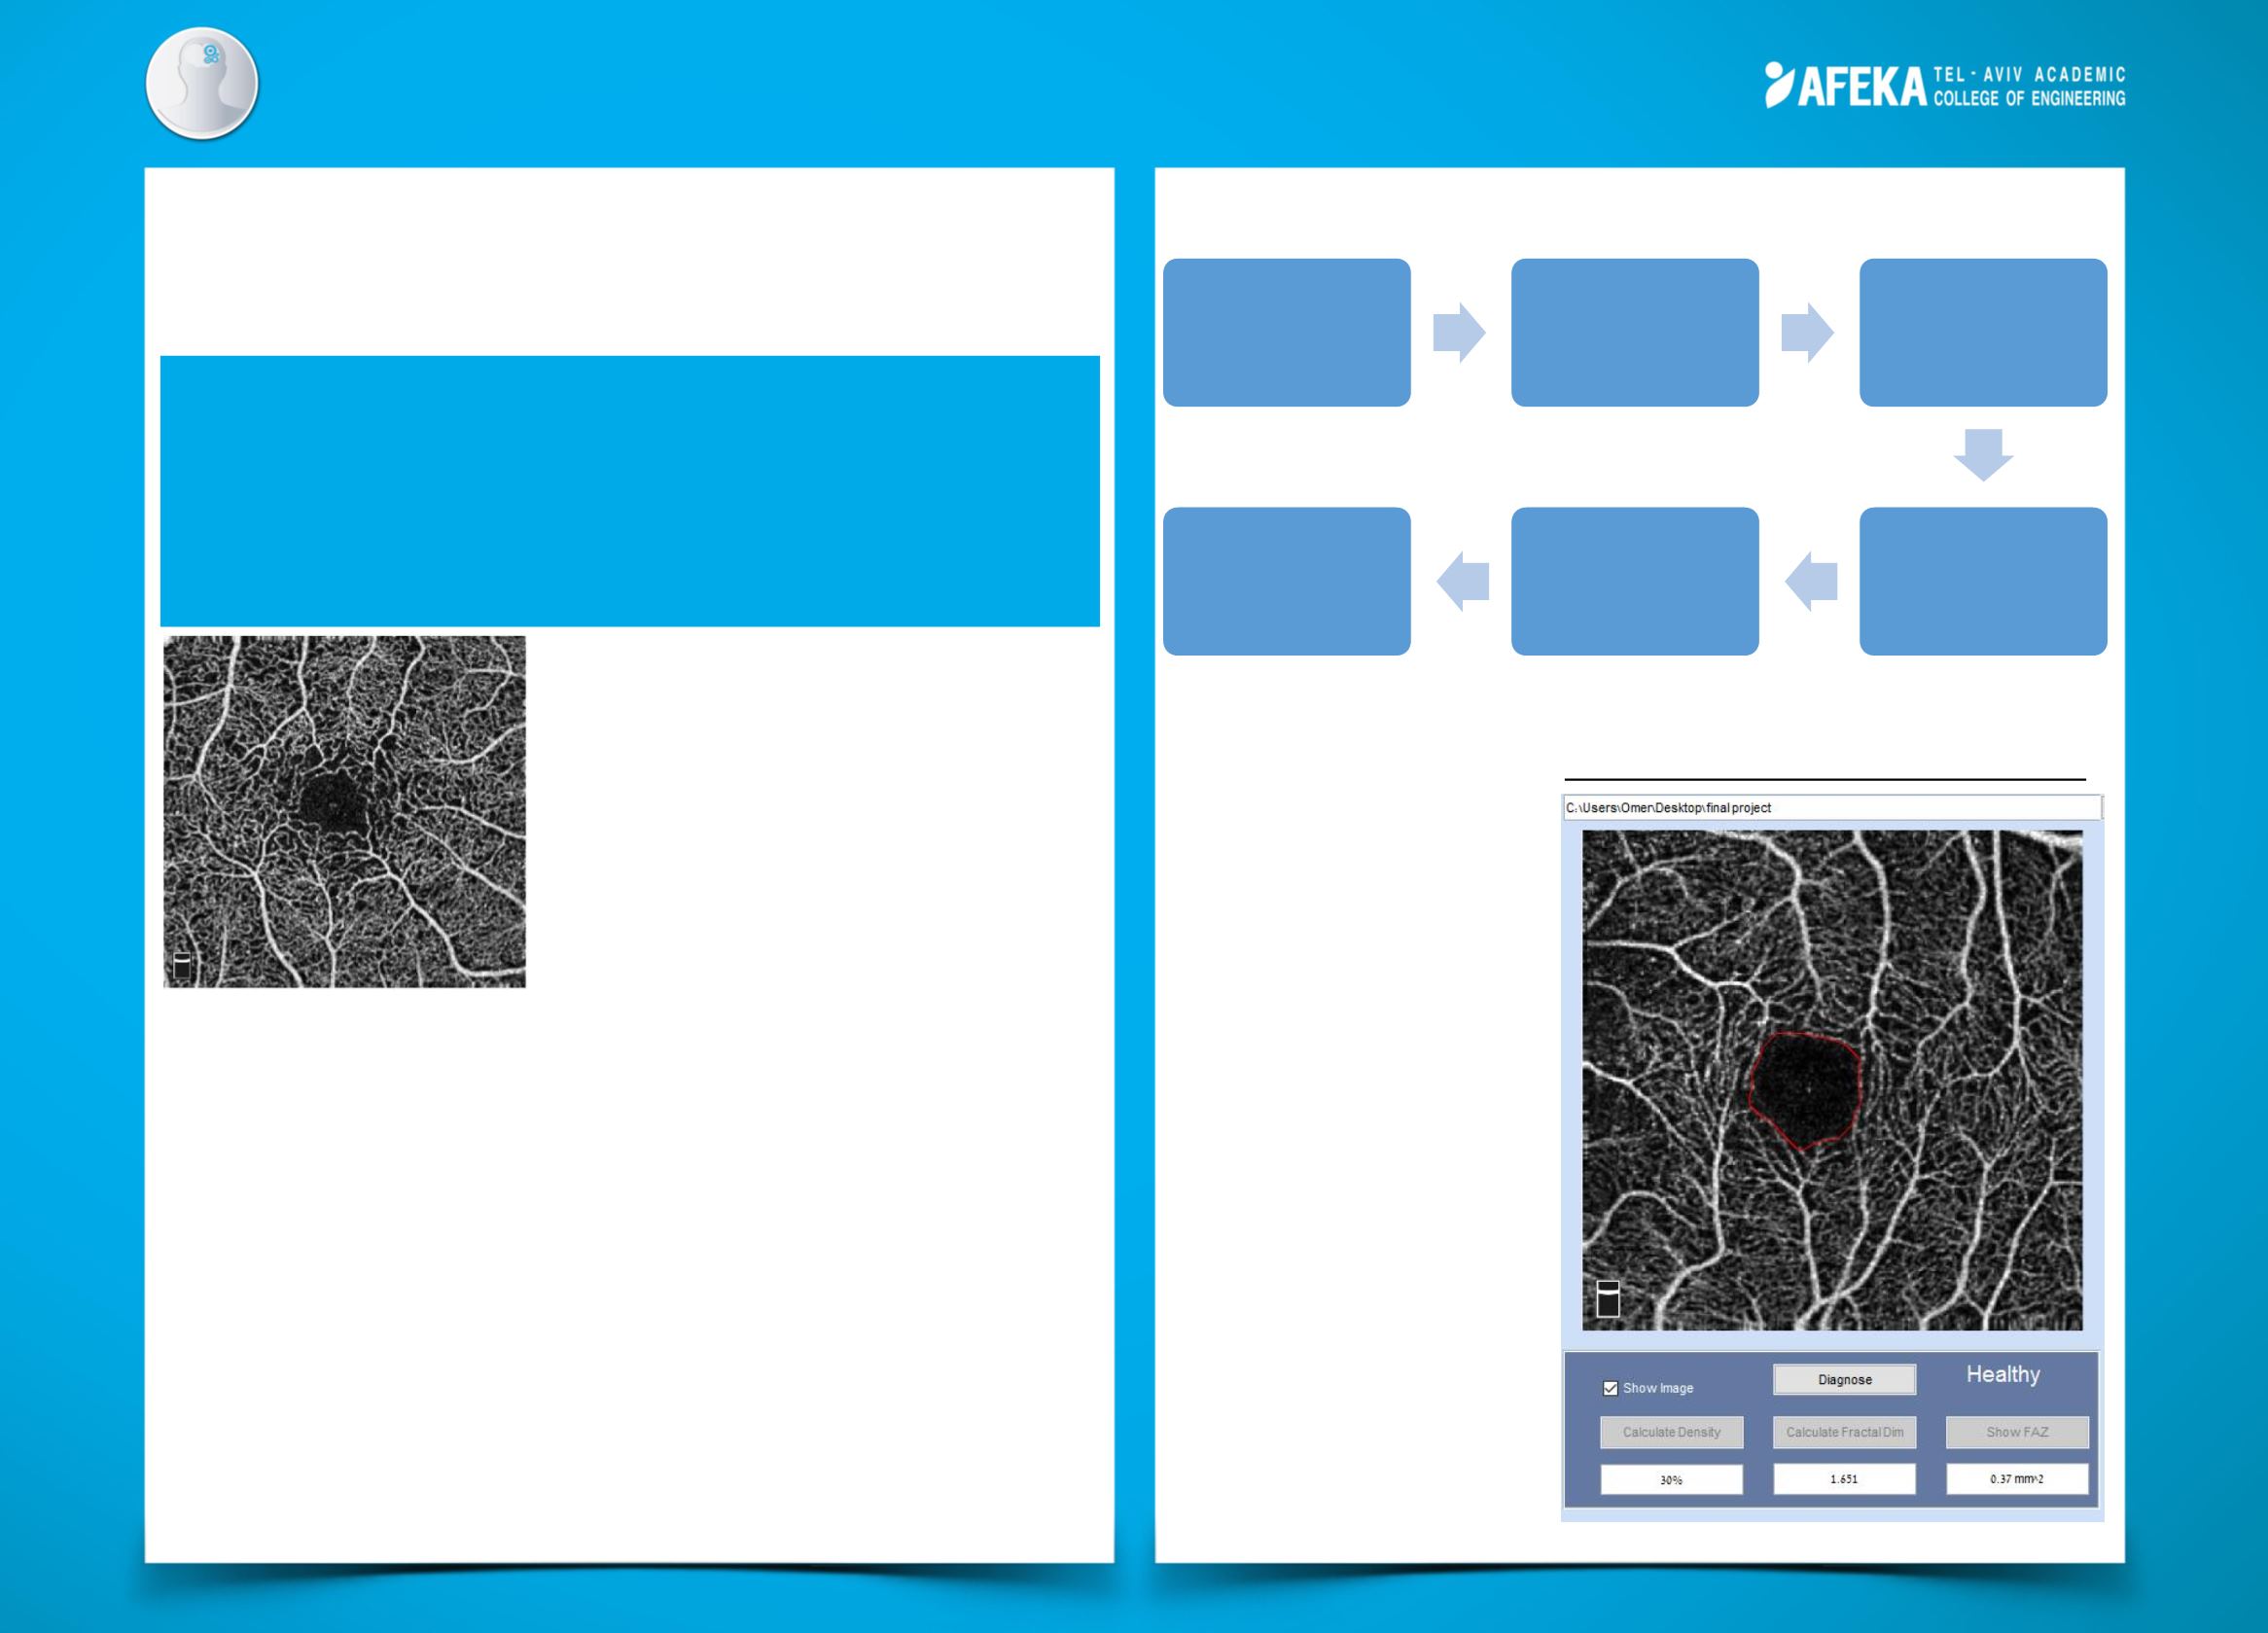
The algorithm is divided into six steps:
o
Automatic diagnosis using the input image, based on analysis of
gray level histogram statistical parameters.
o
Applying a Frangi
Results of the algorithm (Healthy case)
vesselness filter on the
input image to achieve
vessel enhancement.
o
Converting the filtered
image to a binary one
using Otsu’s method.
o
Applying a morphological
filter to eliminate noise.
o
Calculating the FAZ area.
o
Calculating Hausdorff
fractal dimension using
box- counting method.
Calculating vessel density
by computing the relative
part of the image
containing blood vessels.
A Computerized System for Retinal Blood Flow
Characterization using Angio OCT Images
Optical coherence tomography
angiography (OCTA) is an Imaging
technique that provides microvascular
flow maps by using motion contrast.
OCTA is used for visualizing retinal
diseases such as Retinal Vein Occlusion
(RVO), Diabetic Retinopathy (DR),
Age-related Macular Degeneration (AMD)
and other retinal vascular diseases. All of
those diseases are characterized by ophthalmic abnormal blood flow
.
In order to assist the physician in diagnosing patient condition, an
algorithm that provides quantitative information characterizing retinal
blood flow was developed in this project. In addition, a Graphic User
Interface (GUI) was designed in order to display both the OCTA images
and the obtained results to the user.
The algorithm provides quantitative information obtained from the
OCT angiograms, which Includes global vessel density, global
Hausdorff fractal dimension and Fovea Avascular Zone (FAZ) size.
This project was performed in collaboration with Dr. Orly Gal-Or and
Dr. Asaf Polat from the Dept. of Ophthalmology, Rabin Medical Center.
Student’s name: Omer Aharony
Advisor: Dr. Yair Zimmer
Medical Engineering
Developing an automatic algorithm (MATLAB) that
characterize retinal blood flow in order to assist
ophthalmologists with analyzing retinal OCTA images. That is
accomplished by providing quantitative information of
retinal vessel density and textural parameters that can
indicate the patient condition